Combining graphviz (dot) and TikZ with dot2tex
Jul 8, 2013 23:06 · 395 words · 2 minutes read
We all want to create good looking documents and good looking documents need good looking images. Because we want consistency and because we are lazy we want to do this as automatic as possible. That is why we use LaTeX, it creates beautifully typeset documents without much manual effort.
Similarly, we use graphviz to generate our graphs for us. It’s automatic layout is the best in the
field and the (declarative) dot language is easy to understand and compact to write. We can either include the PDFs dot generated in our document by using \includegraphics or we could use the latex graphviz package, remember that we are lazy. We can easily get
the image in our first example in our PDF.
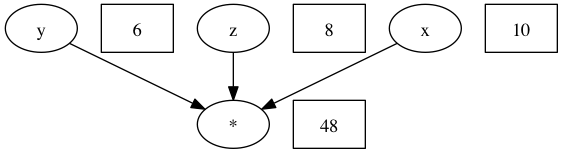
There is a shadow side to using Graphviz/dot as well. There are two problems. Firstly, the image just looks a bit out of place around the nicely smoothed text in a PDF. Secondly, we lack the ability to use TeX code in our graph. This means we are limited to the formatting by dot and the graphs could therefore appear out of style with other figures in our document.
No worries, with TikZ it is possible to create very fancy graphs and images in general but you have to all the positioning manually! Imagine inserting a node and having to reorder everything!
Enter dot2tex it brings all the love of graphviz/dot to TeX/TikZ. Using dot2tex has many advantages:
- Lets you write your graphs in familiar dot syntax;
- Let dot – or whichever layout engine you prefer – determine the placement of your nodes and arrows;
- Style your nodes however you want by using TikZ styles;
- Optionally, fine-tune the graph by adding extra tikz drawings.
Rather than manually calling dot2tex for every dot file you have please use the dot2texi package. This is the interface to dot2tex and when used as follows generates the image as displayed in Figure 2.
  \begin{tikzpicture}[>=latex',scale=0.5]
    % set node style

    \begin{dot2tex}[dot,tikz,codeonly,styleonly,options=-s -tmath]
        digraph G  {
            node [style="n"];
            p [label="+"];
            t [texlbl="\LaTeX"];
            6
            8
            10-> p;
            6 -> t;
            8 -> t;
            t -> p;
            {rank=same; 10;6;8}
        }
    \end{dot2tex}.
    \begin{pgfonlayer}{background}
        \draw[rounded corners,fill=blue!20] (6.north west) -- (8.north east) -- (t.south east)--cycle;
    \end{pgfonlayer}
\end{tikzpicture}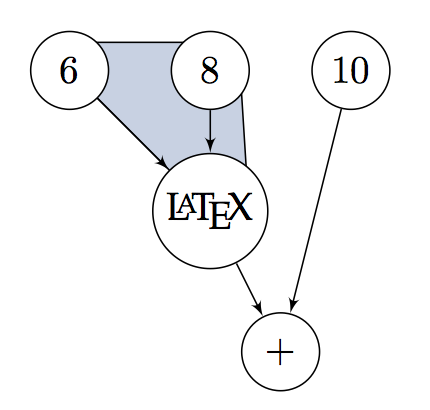
For more TikZ goodness check out the example site.
Happy writing!